March 3, 2020
 It seems the weather has always been a source of mystery. Early efforts to understand and predict atmospheric conditions were largely done by observation. Even as rudimentary instruments were introduced to gauge things like temperature, humidity, and atmospheric pressure, meteorology was far from a perfect science.
First attempts at satellite imagery brought the development and impact of weather patterns into the fold of meteorological research.1 Radar data and storm attributes were considered viable tools for storm tracking, and decades of satellite refinement marshalled the power of land and oceanographic remote-sensing devices for pinpoint forecasting accuracy.1
GIS Cloud computing and analytics continue to strengthen meteorological mapping and pursuits, but where the data is emerging as particularly beneficial is in better understanding climate change.
Mapping Climate Change
Climate change is wreaking havoc on the planet, and only some of its impact is currently being evidenced in global ecosystems. Understanding what the future likely holds can be daunting, especially for the public at large. Abstract discussions about forecasting and atmospheric implications can make the matter seem remote and not necessarily applicable to people’s lives.2
This reasoning is the impetus behind an interactive map that helps the general public visualize the effects of climate change over the next several decades. Clicking on their home city — or any mapped city — brings the reality of climate change into sharp focus. See the map below:
.jpg?width=600&name=Climate%20Change%20Interactive%20Map%20(002).jpg) Source: Wired, This Scary Map Shows How Climate Change Will Transform Your City, February 12, 2019
Source: Wired, This Scary Map Shows How Climate Change Will Transform Your City, February 12, 2019
It’s a technique known as climate-analog mapping. This GIS-powered digital map uses current and historical climatic data, NOAA weather data, and forecasts to display where and how the climate will be transformed if emissions continue to rise. In short, it helps lay people gain perspective on the seriousness of climate change.2
Preparing for an Uncertain Future
There is a public-safety aspect to climate-analog mapping as well. The data gives municipalities an advantage in natural disaster preparedness and recovery.
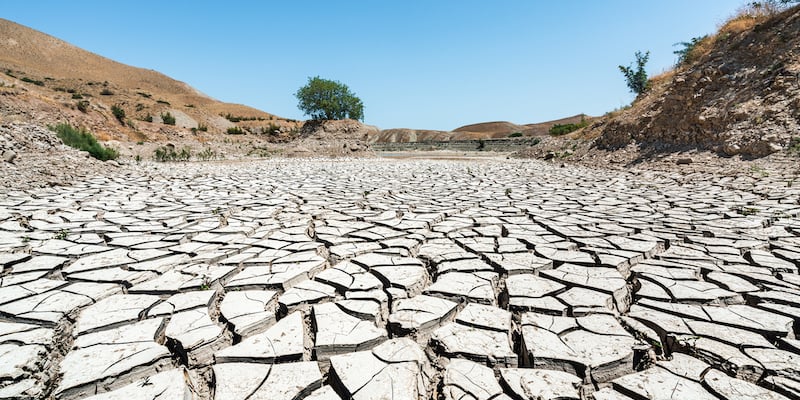
Extreme heat and water shortages are predicted outcomes of long-term climate change. To ward off the far-reaching and potentially devastating impact of either factor, some cities are taking steps now.
For example, data suggests Los Angeles will eventually see fewer but more intense rainstorms as a consequence of climate change. City planners proactively designed road medians containing a network of cisterns to gather and store rainfall from the intense storms. The purpose? Alleviating reliance on piped-in water that may or may not be available to service the population. It’s an important step toward public safety brought about by GIS.
Preparedness is also essential for GIS professionals as they contribute to weather- and climate-related analysis and solutions. High-quality map data drives solid decision making as you’ll discover in TomTom MultiNet: A Handbook for GIS Professionals. Click the button below to download your copy!
SOURCES
1esri, Predicting the Weather with Advanced GIS, Summer 2017
2Wired, This Scary Map Shows How Climate Change Will Transform Your City, February 12, 2019

4 Posted Speed Limit Databases You Need to Know About Now
Make and Manage Critical Decisions With TomTom Map Data in AutoCAD Format